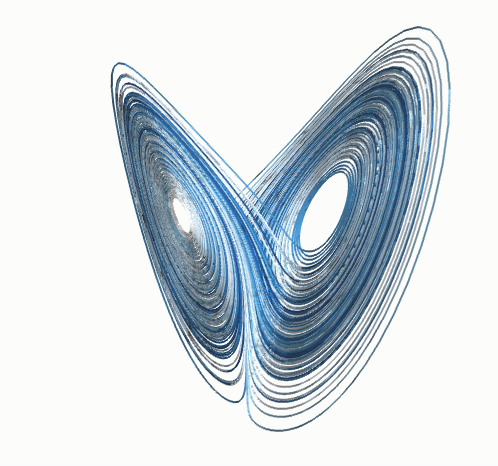
What is interesting is that the 8:3 ratio is close to the square of the Golden Ratio. The Golden Ratio is used in many non-ergodic problems.
I get in trouble with the real chaos guys using ergodic and non-ergodic. There are lots of types of chaos, some have useful "solutions" or probability densities and some don't.
"In mathematics, the term ergodic is used to describe a dynamical system which, broadly speaking, has the same behavior averaged over time as averaged over the space of all the system's states (phase space). In physics the term is used to imply that a system satisfies the ergodic hypothesis of thermodynamics." from Wikipedia again.
Ergodic there is equal probability of a particle occupying any portion of the phase space, non-ergodic, not the same. The time frame is important, perhaps more important to me than it should be, because I consider more things non-ergodic. That doesn't mean that they can't show ergodic behavior over a reasonable time frame. So it is a bit of a semantics standoff.
Climate is non-ergodic because of entropy. Nothing in the distant future will be the same, continents drifts, volcanoes erupt, earthquakes shift things, erosion washes things away and man among others does stuff. Every thing is constantly evolving and de-volving. But, the probability of things being in a range for a "reasonable" time frame is pretty good. I am just not in charge of "reasonable". The Golden Ratio does appear to be somewhat useful in estimate the range just not the time.
This is a simple chart of a 4.1 period sine wave and its first three harmonics. Since I reused the chart for a number of plots, this is double but you should get the drift. The first harmonic has the most impact then yada yada. Predictable results with typical noise.
This chart is of 4.1 and 2.15 period sine waves, related to the 41ka and ~21.5ka obliquity and precessional orbital cycles respectively. Pretty obvious.
The distribution of the ocean area per hemisphere is unequal with the NH having less and the SH more. If there were no sea ice, the NH above 25N would have about 76 units compared to the SH 124 units. That is a ratio of 1.63 and with sea ice change the ratio would pass through the GR. From 45N the ocean units are about 35 for ice free with the SH at 60 units, a ratio of 1.71, larger gap from the GR but since NH sea ice is more variable, the ratio could get close to the GR squared or the SH ice extent could expand to reach the GR ratio. There is no perfect match of the GR, but it is obtainable without lots of imagination required.
Using the ocean ratios instead of the GR, the curve looks like thing. As you can see there is a pretty close similarity to the GR "harmonics" plot. I doubt that just playing with the GR or ocean ratio I could get a perfect match to paleo, but there is enough similarity to assume that some fluctuation in a similar range is likely in the future. The peak at zero in all the charts is perfect synchronization which is highly unlikely, but still slightly possible since other events can "reset" the internal cycles but not the driving solar cycles.
As I mentioned in previous post, the shorter precessional cycle appears to have become more dominate, especially in the SH paleo data, which will change things in the future, but probably not very soon in a major way.
However, it is really unlikely that distant past conditions during the bad old 41 ka dominate regime will appear any time soon. Comparisons of possible impact due to CO2 increase like some of the steamy past periods with no Antarctic Circumpolar current are not valid, IMHO, given the current SH ocean circulation which thermally isolates Antarctica.
While all of this is interesting, my problem is finding out just have much of a role the salt water freezing temperature/energy may have on stabilizing i.e. creating a "strange" attractor for one of the apparent bi-stable conditions. The simple static model indicates that it is pretty likely, but that is not very convincing as it stands now. There is a lot more stuff going on.
I just posted this mainly so I don't lose it. There are a couple of papers in the works on the deep ocean timing that will be help or quash this theory. Once they come out I will come back and do some updates.
Until then, how the Golden Ratios seem to match the static model base values is interesting.


No comments:
Post a Comment