
This compares what I call the Hot tropics, 10S-10N with expanding ocean areas plus a NH and SH 0-30 degree band. Areas of de-correlation should be related to perturbations like Volcanic activity or changes in ocean circulation that could be related to sea ice extent or shifting of atmospheric circulation patterns. Toggwieler, J. R. with the GFDL mentions the "shifting" westerlies or changes in the Inter-tropical convergence zones (ITCZ) as a larger than many expect climate variable.
As should be expected, the correlation decreases as distance from the reference zone increases. What is interesting is that the Southern Hemisphere (30S-0), the darkest green curve, and the Northern Hemisphere (0-30N) light blue curve, maintain a good correlation with the hot tropics and surprisingly well with each other.

This is the same 30 year sliding correlation between those two regions. The roughly 1913 volcano shows as a small spike and the major climate shifts (red) seem to be where they would be expected except for around 2005 there is an indication of some other shift. That shift is in the warmer direction, but pretty short term so far. The main reason I am doing this is to see how well the sliding correlation window aligns with perturbations and that one is a bit of a surprise. The other black arrow appears to be volcanic related but Pinatubo in 1991 is missing. Pinatubo may have had equal hemispheric impact so it wouldn't show up in this correlation. Somewhat surprisingly, Pinatubo doesn't really stand out in the other correlations. It may have been more of an atmospheric thing than an ocean thing.
In any case these correlations are interesting to me. I had expected the shifts to stand out and there to be a long term improvement in correlation, but not the major shift following the 1998 Super El Nino. However, that shift seems to be related to surface winds, shifting westerlies, agreeing with Toggwieler, who might be a good addition to a lot of folks reading lists. What wind data there is though just indicates an increase from a low around 1930-1940 without much variation.

Land surface temperature though gets most of the press. Since land and ocean should be closely coupled, there should be a fairly high correlation between land and ocean temperatures. Using the same main ocean bands I substituted the BEST global land for the Sstv4 (10S-10N) original reference to get this group of correlations.

This is a bit more interesting. The same 1913 volcanic perturbation results in the lowest correlation then the correlation increases with time. That to me would indicate either long term persistent recovery from past cooling and/or issues with the temperature data sets. BEST uses kriging though and with most older long term stations being coastal, long term persistence should have a greater potential, with the exception of recent higher latitude station made practical with modern equipment.
In any case, there is a perturbation, ~1913, apparently due to the largest volcano of the 20th century, that was not include in model forcing estimates that has an obvious impact on temperatures.


"Forcing" though is not as simple as it may seem. "Atmospheric" forcing is the focus of the models and the huge heat capacity of the oceans can "make-up" for negative atmospheric forcing and buffer positive forcing. Satellite and ARGO era measurements make up for the limitations of "surface" temperature now but that doesn't help in determining if there is long term persistence.

With actual temperatures you can get a rough estimate of the change in atmospheric forcing. You can't attribute the change very easily, but you can estimate the magnitude of the change. Since the Oceans and atmosphere de-correlate fairly often, this might provided some insight but is going to be controversial. This chart is based on seasonal (not actual Tmax and Tmin used to estimate Tave) Tmax and Tmin values for the regions in the legend using hadcrut Ts which is in C degrees. CRUTs isn't intended to be a "global" temperature product but it does try to capture maximum and minimum values for determining dates of first frost and such. The change in energy associated with Tmax and Tmin is surprisingly consistent for these regions. I excluded the highest latitudes because that is were CRUTs accuracy seems to suffers most as should be expected. According to this, there wasn't much change in atmospheric forcing until 1985 which is a problem period due to changes in surface temperature instrumentation. In any case, this seems to indicate that current atmospheric forcing is about 4 Wm-2 above the 1901 to 2013 average.
While some might not like the CRUTs, Berkeley has an actual temperature estimate with about the same results.


The actual Tmin is currently being questioned due to variation the the nocturnal boundary layer as subject for another day.
The ~1913 volcanic perturbation shows up most strongly in the BEST NH Tmin energy approximation and BEST SH seems to indicate a continuous long term persistent recovery starting prior to that perturbation. Remember all these used a 1901 to 2013 baseline.

Using the SSTv4 50S-50N temperature which had the best combined correlation with land temperatures I can also estimate forcing using the Crowley and Unterman 2013 Volcanic combined with the BEST interpolation of CO2. I used a 1.6 C "sensitivity" estimate for CO2 forcing as a reference to all forcing aligning with the peak values. This assumes that the evident cooling was natural/volcanic. The volcanic forcing does not line up well with temperature (in this case converted to energy) response. Assuming all the natural/volcanic cooling has completely recovered, the current atmospheric forcing is about 2.5 Wm-2 greater than it was in circa 1880.

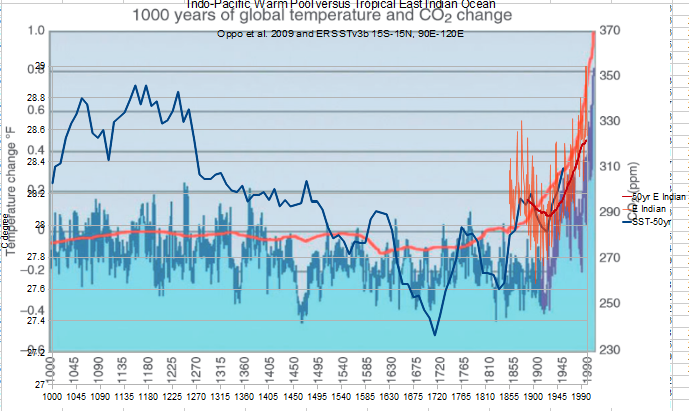
Using the same baseline for comparison with "known" forcing equaling about 2 Wm-2 and SST for the 50S-50N region starting below the 1901-2013 mean, about half of the forcing indicated using the Land temperature data could be recovery from a long term persistent cool period just as indicated in the Oppo et al. 2009 Indo-Pacific Warm Pool reconstruction.
I am positive that this rambling look at various estimates of changes in atmospheric forcing isn't going to sway any believers, but it might inspire some to redo this in a more easily followed manner with more precise citations and proper jargon. From my perspective, not including the more recent volcanic forcing estimates and not focusing on ocean and regional response has lead many modelers down a garden path. It might be time to review some of the previous work of others, like Herbert Lamb.

No comments:
Post a Comment